
Understanding What Makes a Neighborhood Profitable for Flipping
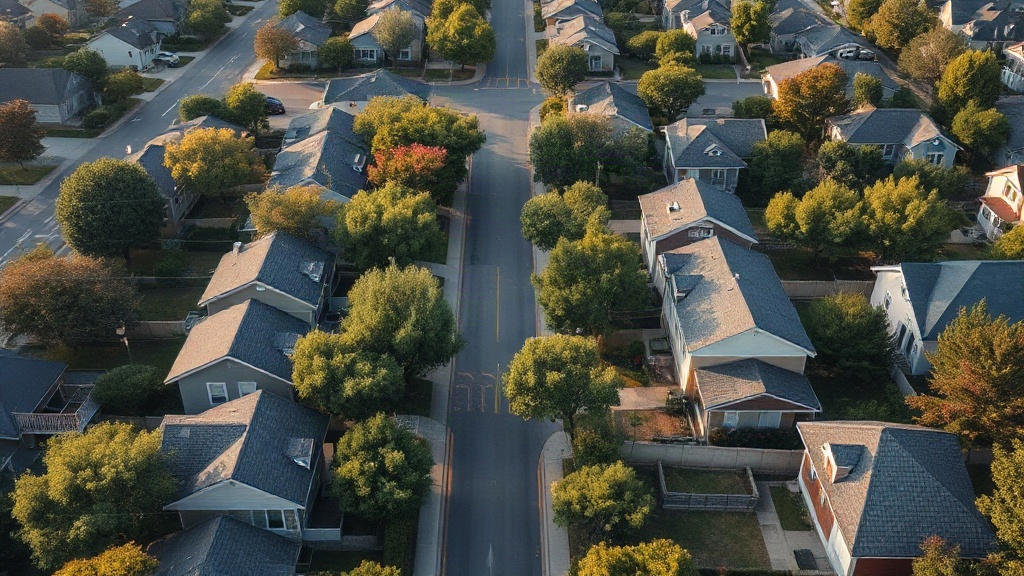
Choosing the right neighborhood is one of the most critical steps in any fix & flip strategy. A profitable neighborhood has key characteristics that indicate strong demand and a healthy return on investment. Ignoring these factors can leave you tied up in a deal that struggles to sell or delivers weak profits. Start by looking at local growth trends. Are property values in the area rising steadily year-over-year? A neighborhood with increasing home prices signals strong buyer demand, making it easier to sell your flipped property quickly at a higher price.
Want to skip the spreadsheet? FlipSmrt pulls comps, estimates ARV and rehab, and runs the deal math from just an address. Your first 3 analyses are free.
Another vital factor is the average days on market (DOM). A low DOM indicates that properties in the area are selling quickly, which reduces your holding costs and ensures a faster turnaround. For example, a neighborhood where homes sell in 30 days on average is much more attractive than one with a 90-day DOM. You can find this data on real estate listing sites or by consulting a local real estate agent. Aim for areas with DOM below the regional average for the best flipping opportunities.
Potential After Repair Value (ARV) is equally crucial. Look at recent sales comps within a half-mile radius of your target property. These comps should reflect similar properties in size, age, and condition to what your flipped property will be. For instance, if updated three-bedroom homes in the area are consistently selling for $300,000, this gives you a realistic ARV to work from. Be wary of neighborhoods with wildly fluctuating ARVs, as this uncertainty can lead to misjudged profits.
Additional indicators of a profitable neighborhood include new developments, proximity to amenities (like schools, parks, and shopping centers), and signs of gentrification, such as renovated homes and new businesses moving in. These factors attract buyers, boosting your chances of a successful flip. By focusing on neighborhoods with these attributes, you can significantly increase the likelihood of a profitable deal.
Step-by-Step: Screening Listings for Fix & Flip Potential
Efficiently screening listings is the first step in identifying a profitable fix-and-flip deal. Let’s break it down with a practical example. Imagine you come across a property listed for $150,000 in an area where flipped homes with similar specifications sell for around $300,000 after renovation. The goal is to quickly assess whether this deal might be worth pursuing further.
Start with the After Repair Value (ARV). To estimate ARV, examine comparable sales (“comps”) in the neighborhood. Look for properties with similar square footage, the same number of bedrooms and bathrooms, and ideally, ones renovated to a standard you intend to achieve. If three recent comps sold for $290,000, $305,000, and $300,000, you can reasonably assume the ARV for your target property is $300,000.
Next, estimate the repair costs. For this example, let’s assume the property requires moderate updates: a new roof, cosmetic changes, and upgraded appliances. Based on local contractor rates and a detailed scope of work, you estimate repairs will cost $50,000. This figure will vary depending on the scope, so always review the property condition thoroughly to refine your estimate.
Now, apply the 70% rule to calculate your Maximum Allowable Offer (MAO). The formula is straightforward: MAO = (ARV x 0.70) - repair costs. Plugging in the numbers: MAO = ($300,000 x 0.70) - $50,000. This gives you a maximum offer of $160,000. Since the listing price is $150,000, the deal looks promising on paper. You have $10,000 in wiggle room below the MAO to negotiate or cover unexpected costs.
This step-by-step process helps you filter out overpriced or unworkable deals quickly. By focusing on ARV, repair costs, and the 70% rule, you can avoid wasting time on properties that don’t meet your profitability criteria. Remember, accuracy in your estimates is key—refine your numbers as you gather more details during due diligence.
Evaluating Neighborhood Comps: A Practical Example
To estimate the After Repair Value (ARV) of a potential fix & flip deal, you need accurate comparable sales (comps). Let’s walk through a practical example. Imagine you’re evaluating a 3-bedroom, 2-bathroom property with 1,500 square feet located at 123 Main Street. The neighborhood has seen a mix of renovated and unrenovated sales in the past 6 months. Your goal is to find the most similar properties that have sold recently to predict your ARV.
Start by pulling three to five comps from the same neighborhood, ideally within a 0.5-mile radius. Focus on properties with similar features: same number of bedrooms and bathrooms, similar square footage (within 10-15%), and a comparable lot size. For example, you find three comps:
- Comp 1: 3 beds, 2 baths, 1,450 sq. ft., recently renovated, sold for $290,000.
- Comp 2: 3 beds, 2 baths, 1,550 sq. ft., recently renovated, sold for $305,000.
- Comp 3: 3 beds, 2 baths, 1,500 sq. ft., partially renovated, sold for $275,000.
Adjust these comps for differences that could affect value. For example, Comp 3 is only partially renovated, so its sale price reflects a lower standard of finishes. Add $15,000 to account for the difference, bringing it to $290,000. For Comp 1, the slightly smaller square footage may warrant a $5,000 upward adjustment, bringing it to $295,000. Comp 2, with slightly more square footage but otherwise similar, needs no adjustment.
Now, average the adjusted values of your comps: ($295,000 + $305,000 + $290,000) / 3 = $296,667. This gives you a solid ARV estimate of around $297,000 for 123 Main Street. However, always contextualize this number with knowledge of the local market. If demand in the neighborhood is rising or inventory is low, you might lean toward the higher end of your range.
Evaluating comps accurately is a skill that requires practice. By learning how to adjust for key differences and account for market nuances, you can refine your ARV estimates and approach each deal with confidence.
Run these numbers on a real deal in under 5 minutes
FlipSmrt turns an address into ARV, a rehab budget, and your Maximum Allowable Offer automatically.
Analyze a Property FreeEdge Cases: When a Property or Market Breaks the 70% Rule
The 70% rule is a trusted benchmark for fix & flip deals, but like any rule of thumb, it has its exceptions. Some properties or markets don't fit neatly into the formula, and understanding these edge cases can help you make smarter investment decisions. One common exception is high-growth markets. In areas where property values are rising rapidly, buyers often pay more than 70% of the ARV minus repairs because they anticipate continued appreciation. For example, in a fast-growing city, even if your MAO (Maximum Allowable Offer) under the 70% rule is $200,000, you might find investors paying $220,000 or more, betting on future value increases.
Another edge case is properties with unique or hard-to-quantify features. A home with a striking view, historical significance, or luxury finishes might justify a higher offer, even if the math doesn't align perfectly with the 70% rule. For instance, if you're flipping a house with oceanfront access, the market may be willing to pay a premium that isn't captured in a straightforward formula. In such cases, it's essential to adjust your ARV by analyzing comps with similar features rather than relying on standard averages.
Conversely, certain markets or property types might justify a stricter rule. In rural areas or slow-growth markets, reselling a property might require deeper discounts to attract buyers. Here, sticking to 65% of ARV (or even lower) could be more prudent to account for longer holding times and less predictable demand. For example, if the ARV is $150,000 in a low-demand area and repairs are $30,000, your MAO might need to drop to $67,500 (ARV x 0.65 - $30,000) instead of the usual $75,000 under the 70% rule.
Adjusting your analysis for these exceptions requires a deep dive into local market dynamics and property specifics. When the 70% rule doesn’t fit, focus on alternative metrics like cash-on-cash return or cap rate to ensure the deal still delivers the returns you need. Flexibility and a willingness to adapt your approach are key to thriving in unique markets or with unusual properties.
Common Mistakes in Deal Screening That Cost New Investors
New investors often approach deal screening with optimism, but certain mistakes can turn a promising fix & flip into a financial headache. One of the most common errors is relying on unrealistic After Repair Value (ARV) estimates. Overestimating the ARV means you might pay too much for the property, leaving little to no profit margin after renovation and resale. For example, if you estimate an ARV of $300,000 but realistic comps show closer to $270,000, your math is off by $30,000—a gap that can destroy your profit. Always base your ARV on recent, comparable sales in the same area, not on wishful thinking or overly optimistic real estate listings.
Another frequent mistake is underestimating renovation costs. It's easy to overlook hidden expenses or assume a cosmetic rehab when the property may need structural repairs. For instance, you might budget $30,000 for repairs, only to discover issues like outdated plumbing or foundation cracks that push costs to $50,000. This $20,000 discrepancy can wipe out your projected profit. To avoid this, walk the property with a contractor or refer to detailed cost breakdowns from similar projects in your area. Always build a buffer—unexpected expenses are almost guaranteed.
Ignoring red flags is another costly misstep. Structural issues, like water damage or illegal additions, can be expensive to address and delay your timeline. Similarly, a bad location—whether it’s high crime rates, proximity to industrial sites, or poor school districts—can hurt resale value. A cheap property in a hard-to-sell area is rarely worth the risk. Take time to research the neighborhood and understand buyer demand before committing to a deal.
To avoid these pitfalls, focus on accurate data, realistic projections, and thorough due diligence. Screen every deal as if your profit depends on it—because it does. Missteps in ARV, rehab costs, or red flags can turn a deal upside down. Double-check your numbers, and don’t skip the on-the-ground research. A cautious approach now saves costly surprises later.
FAQ: Quick Answers to Screening and Red Flag Questions
What’s a dealbreaker on a listing? Major structural issues like foundation cracks, significant water damage, or mold can often be dealbreakers, especially for new investors. These problems tend to have unpredictable repair costs that can blow your budget. If you're experienced and know how to price these repairs accurately, it might still be worth pursuing. However, for most, properties with extensive structural issues should be avoided unless they come at a steep discount.
How do I spot an overpriced property quickly? Compare the listing price to recent comparable sales (comps) in the same neighborhood. For example, if similar-sized homes in the area sold for $250,000 and the listing is priced at $300,000, it’s a red flag. Overpricing often signals either an unrealistic seller or a property that won’t leave enough margin for a profitable flip. Tools like FlipSmrt can pull comps instantly, saving you hours of manual research.
What are the most important comps to look at? The best comps match the property in size, bedroom/bathroom count, and style, and they should ideally have sold within the last 6 months. Location is also critical—the closer the comp to the subject property, the better. For example, if you're evaluating a 3-bed, 2-bath ranch-style home with 1,500 square feet, a nearby sale of a 2,800-square-foot colonial is not a useful comparison, even if it’s recent.
Are properties with long days on market (DOM) a bad sign? Not necessarily. Long DOM can indicate a seller who is more open to negotiation, which might work in your favor. However, it’s important to investigate why the property hasn’t sold. If it's due to an undesirable location or factors you can’t fix, like being next to a freeway, it might be best to walk away. If the issue is cosmetic or easily fixable, it could be an opportunity.
What’s the biggest red flag when analyzing a neighborhood? Pay attention to declining property values. If recent sales show a consistent downward trend, flipping in that area might be too risky. Look for stable or appreciating markets with strong demand. High vacancy rates or a concentration of distressed properties are also warning signs that buyers might avoid the area, making it harder to sell your flip profitably.
Ready to analyze your next deal?
Get ARV, renovation estimates, and full deal math in under 5 minutes. Your first 3 analyses are free.
Start Free Analysis