
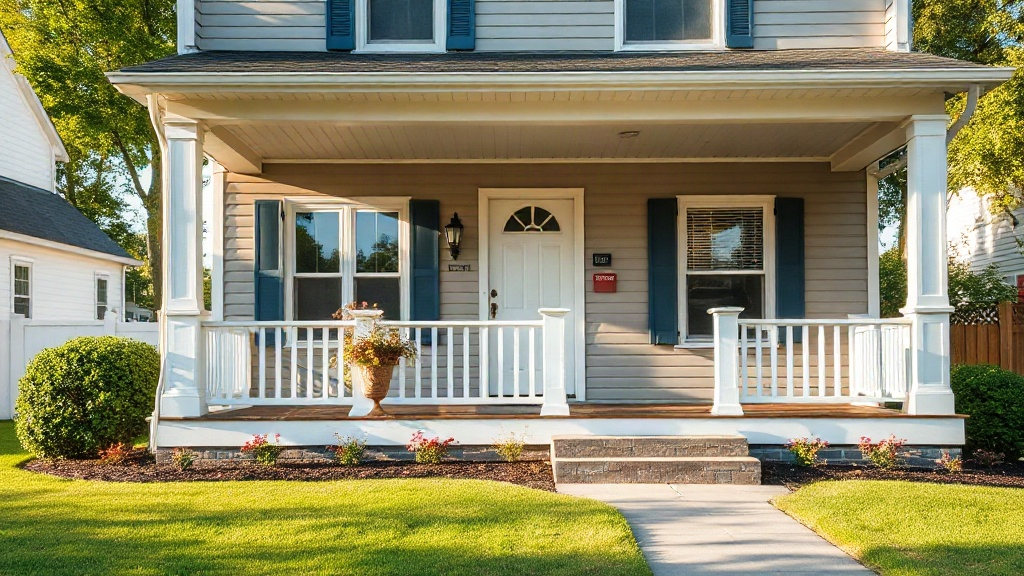
The Core Metrics of Rental Analysis
When evaluating a rental property, four core metrics guide most investment decisions: cash flow, cap rate, cash-on-cash return, and net operating income (NOI). Each one measures a different aspect of the investment, from profitability to efficiency, and together they provide a clear picture of a rental's potential. Here's what each metric means and how to calculate it.
Want to skip the spreadsheet? FlipSmrt pulls comps, estimates ARV and rehab, and runs the deal math from just an address. Your first 3 analyses are free.
Cash Flow is the amount of money left over each month after all expenses are paid. Start with the gross rental income (monthly rent) and subtract operating expenses like property taxes, insurance, maintenance, and property management fees. For example, if a rental generates $2,000/month in rent and has $1,200/month in expenses, the cash flow is $800/month. Positive cash flow indicates the property earns more than it costs to operate.
Net Operating Income (NOI) represents the property's profitability before financing costs. The formula is simple: NOI = gross income - operating expenses. If the annual gross income is $24,000 ($2,000/month) and operating expenses total $14,400/year, the NOI is $9,600. NOI is key for comparing properties because it excludes debt service, keeping the focus on the property's performance.
Cap Rate (capitalization rate) measures the return on investment if you purchased the property outright with cash. Calculate it using Cap Rate = NOI / purchase price. For a property with a $9,600 NOI and a $200,000 purchase price, the cap rate is 4.8%. A higher cap rate typically signals a stronger return, but it can also indicate higher risk or less desirable markets.
Cash-on-Cash Return evaluates how effectively your invested cash is generating returns. The formula is Cash-on-Cash = annual cash flow / total cash invested. If you invested $50,000 (down payment and closing costs) and the property produces $9,600 in annual cash flow, the cash-on-cash return is 19.2%. This metric is especially useful for investors leveraging financing, as it focuses on cash invested rather than total property value.
Mastering these metrics is essential for any rental investor. They help you assess a property's financial health, compare opportunities, and decide if it's worth holding. Always run the numbers carefully to avoid costly mistakes.
Worked Example: Calculating Cash Flow and NOI
Understanding how to calculate cash flow and Net Operating Income (NOI) is crucial when evaluating a rental property. Let’s break this down with a realistic example. Imagine you’re analyzing a rental property that generates $1,800 per month in rent, has $900 in monthly operating expenses, and carries a $1,200 monthly mortgage payment. We’ll walk through the steps to calculate both cash flow and NOI.
First, calculate the annual gross rental income. Since the property generates $1,800 per month, multiply this by 12 months:
Gross Rental Income = $1,800 × 12 = $21,600 annually
Next, determine the annual operating expenses. These include property taxes, insurance, maintenance, and other recurring costs. With monthly operating expenses of $900, the annual total is:
Operating Expenses = $900 × 12 = $10,800 annually
Now, calculate the Net Operating Income (NOI). NOI is the gross rental income minus operating expenses:
NOI = Gross Rental Income - Operating Expenses
NOI = $21,600 - $10,800 = $10,800 annually
Finally, let’s calculate cash flow. Cash flow accounts for mortgage payments, which are not included in NOI. Subtract the annual mortgage payments from the NOI. With a monthly mortgage payment of $1,200, the annual total is:
Mortgage Payments = $1,200 × 12 = $14,400 annually
Cash Flow = NOI - Mortgage Payments
Cash Flow = $10,800 - $14,400 = -$3,600 annually
In this example, the property has a negative cash flow of $3,600 per year, meaning you’d be losing $300 per month after all expenses and debt service. While the NOI is positive, the cash flow highlights that this property may not be ideal unless there’s a strong appreciation potential or other financial strategy in play.
Worked Example: Cap Rate and Cash-on-Cash Return
Cap rate and cash-on-cash return are two critical metrics for evaluating rental properties, and they serve different purposes. Cap rate focuses on the property’s overall return relative to its price, while cash-on-cash return zeroes in on the return based on the actual cash you’ve invested. Let’s calculate both using a property priced at $240,000, with a $60,000 down payment.
Start with the cap rate. Assume the property generates $24,000 in annual gross rental income and has $8,000 in annual operating expenses (property taxes, insurance, and maintenance). The net operating income (NOI) is calculated as:
NOI = Gross Income - Operating Expenses
NOI = $24,000 - $8,000 = $16,000
To find the cap rate, divide the NOI by the total purchase price:
Cap Rate = NOI / Purchase Price
Cap Rate = $16,000 / $240,000 = 0.0667, or 6.67%
A cap rate of 6.67% provides a snapshot of the property’s profitability in relation to its price. Investors often compare this to their target cap rate based on market conditions or personal goals.
Now, let’s calculate the cash-on-cash return, which considers the actual cash invested. Assume the mortgage payment (principal and interest only) is $10,800 annually, leaving $5,200 in pre-tax cash flow:
Annual Cash Flow = NOI - Annual Mortgage Payment
Annual Cash Flow = $16,000 - $10,800 = $5,200
Cash-on-cash return is calculated as:
Cash-on-Cash Return = Annual Cash Flow / Cash Invested
Cash-on-Cash Return = $5,200 / $60,000 = 0.0867, or 8.67%
With an 8.67% cash-on-cash return, the property offers a solid return on the initial cash invested. This metric is particularly important for investors focused on liquidity and short-term financial performance.
By breaking down both the cap rate and cash-on-cash return, you can evaluate the property’s potential as a long-term rental investment and how effectively your cash is working for you.
Run these numbers on a real deal in under 5 minutes
FlipSmrt turns an address into ARV, a rehab budget, and your Maximum Allowable Offer automatically.
Analyze a Property FreeWhen Holding Beats Flipping: Key Decision Points
Deciding whether to hold a property as a rental or flip it for a quicker profit depends on the numbers and your long-term goals. Holding makes sense when the property generates strong cash flow, shows potential for long-term appreciation, or offers tax advantages that align with your financial strategy. However, there are scenarios where flipping can deliver better, faster returns. Let’s break down the key decision points.
1. Strong Cash Flow: If the property generates significant monthly cash flow after accounting for mortgage, taxes, insurance, and operating expenses, holding might be the smarter play. For example, if a single-family home rents for $1,800 per month and you calculate $1,200 in total expenses, you’re left with $600 in monthly cash flow. Over a year, that’s $7,200 in pre-tax income, which can grow further with rent increases or by paying down the mortgage.
2. Long-Term Appreciation: In markets with solid growth potential, holding can help you capitalize on rising property values over time. For instance, if you buy a property for $250,000 in an area with 5% annual appreciation, its value could increase to $319,000 after five years. That $69,000 gain is in addition to any rental income you’ve collected during that time.
3. Tax Benefits: Rental properties offer unique tax advantages, such as depreciation deductions and the ability to defer capital gains through a 1031 exchange. These benefits can significantly reduce your tax liability, making holding more attractive in certain financial situations. For example, depreciation on a $250,000 property (assuming $200,000 is allocated to the building) could allow you to deduct roughly $7,273 annually over 27.5 years.
Flipping, on the other hand, might be the better option if the property requires extensive repairs and you can realize a strong profit quickly. For example, if you buy a property for $150,000, invest $50,000 in rehab, and sell it for $275,000, you could net $50,000 in profit after transaction costs. This immediate return might outweigh the slower gains of holding, especially if cash flow or appreciation potential is limited.
The decision ultimately hinges on the numbers. Use metrics like cash-on-cash return, cap rate, and projected profit to evaluate both scenarios. A property with weak cash flow and stagnant appreciation might be a better flip, while one with strong, steady returns is a candidate for a long-term hold. Let the math guide your strategy.
Common Mistakes in Rental Property Analysis
Even experienced investors can fall into traps when analyzing rental properties. Some errors are small but compound over time, while others can completely derail your returns. By recognizing and avoiding these common mistakes, you can set yourself up for better outcomes.
Underestimating expenses is one of the biggest pitfalls. Many investors only account for the mortgage payment, property taxes, and insurance, but forget about ongoing maintenance, property management fees, and capital expenditures. A good rule of thumb is to allocate 10-15% of the monthly rent for maintenance and another 5-10% for capital expenditures. For example, if the rent is $1,500/month, you should set aside at least $150 for maintenance and $75 for capital reserves. Skipping these costs can lead to surprises that eat into your profits.
Another common mistake is overestimating rental income. It's tempting to use the highest rent figure you’ve seen for similar properties in the area, but this can distort your projections. Instead, work with a conservative estimate based on the lower end of market rents. For instance, if comparable units rent for $1,400 to $1,600 per month, use $1,400 in your analysis. This buffer reduces the chance of overextending yourself financially if rents fall short of projections.
Investors often ignore vacancy rates, assuming their property will always be 100% occupied. This is rarely the case. A typical vacancy rate might range from 5-10%, depending on the local market. To account for this, subtract 5-10% from your annual rental income during calculations. For example, if your total rent is $18,000/year, a 5% vacancy rate means deducting $900, leaving $17,100 as the realistic income you can count on.
Avoiding these errors requires discipline and accurate assumptions. Always use conservative estimates for income and realistic numbers for expenses. Tools like FlipSmrt can save time by helping you model these factors instantly, but understanding the risks ensures you make smarter decisions, whether you’re holding or flipping.
FAQ: Quick Questions About Rental Metrics
What is a good cap rate for a rental property?
Cap rates vary by market and property type, but a range of 5-10% is typical. In high-demand areas, cap rates tend to be lower (around 4-6%), while in riskier markets, they may go higher. A "good" cap rate depends on your risk tolerance and investment goals. Always compare it to local averages and similar properties.
How much cash flow is enough to make a rental worth it?
Aiming for at least $200-300 in monthly cash flow per unit after all expenses (mortgage, taxes, insurance, maintenance, etc.) is a common benchmark. This ensures a cushion for unexpected costs and provides a meaningful return. However, your minimum cash flow target may differ based on your financial goals and portfolio size.
What expenses should I include in NOI (Net Operating Income)?
NOI includes all operating expenses but excludes debt service (mortgage payments) and capital expenditures. Typical expenses are property taxes, insurance, property management fees, maintenance, utilities (if paid by the owner), and any HOA dues. For example, if a property earns $24,000 annually in rent and has $8,000 in expenses, the NOI is $16,000.
How does cash-on-cash return differ from cap rate?
Cash-on-cash return measures your annual return based on the actual cash you invested, while cap rate measures the return relative to the property's total value. For example, if you invested $40,000 cash and earn $4,000 in annual cash flow, your cash-on-cash return is 10%. In contrast, cap rate ignores financing and focuses solely on the property's performance.
Should I include vacancy and repair reserves in my analysis?
Yes. Always account for vacancy (typically 5-10% of gross rent) and a reserve for repairs and capital expenditures (often 10-15% of gross rent). Ignoring these can lead to overly optimistic projections and unexpected financial strain later.
Ready to analyze your next deal?
Get ARV, renovation estimates, and full deal math in under 5 minutes. Your first 3 analyses are free.
Start Free Analysis